Data visualization step-by-step plan
During the whiteboard session, the current, most important Key Performance Indicators (KPIs) should be discussed. This will make the thread of the business strategy clear. The whiteboard session will also reveal the management's perspectives. The front page of the dashboard should display the core elements of your organization and thus your strategy at a glance. Therefore, this step is crucial.
Interviewing end-users
It is unnecessary to include all data in the analyses. The models should be developed to be "lean and mean" so that the dashboards remain fast and efficient. We conduct interviews with each end-user group to identify their information needs. This determines not only which data should be included in the analyses but also how the data models should be developed. In the case of many different user groups with completely different information needs, it may be better to develop data marts instead of directly extracting data from a data warehouse.
Analyses
Analysis is conducted in various stages. Therefore, it is advisable to implement the analyses in a logical order. The organization must be prepared for (more) data-driven management. When analyses are implemented at a high pace, there is a greater chance that the new analyses will not be adopted by employees. They are unsure of what actions to take with the new information. This leads to the analyses being parked and no longer used. The analyses should be a connecting factor between the business strategy and the actual execution.
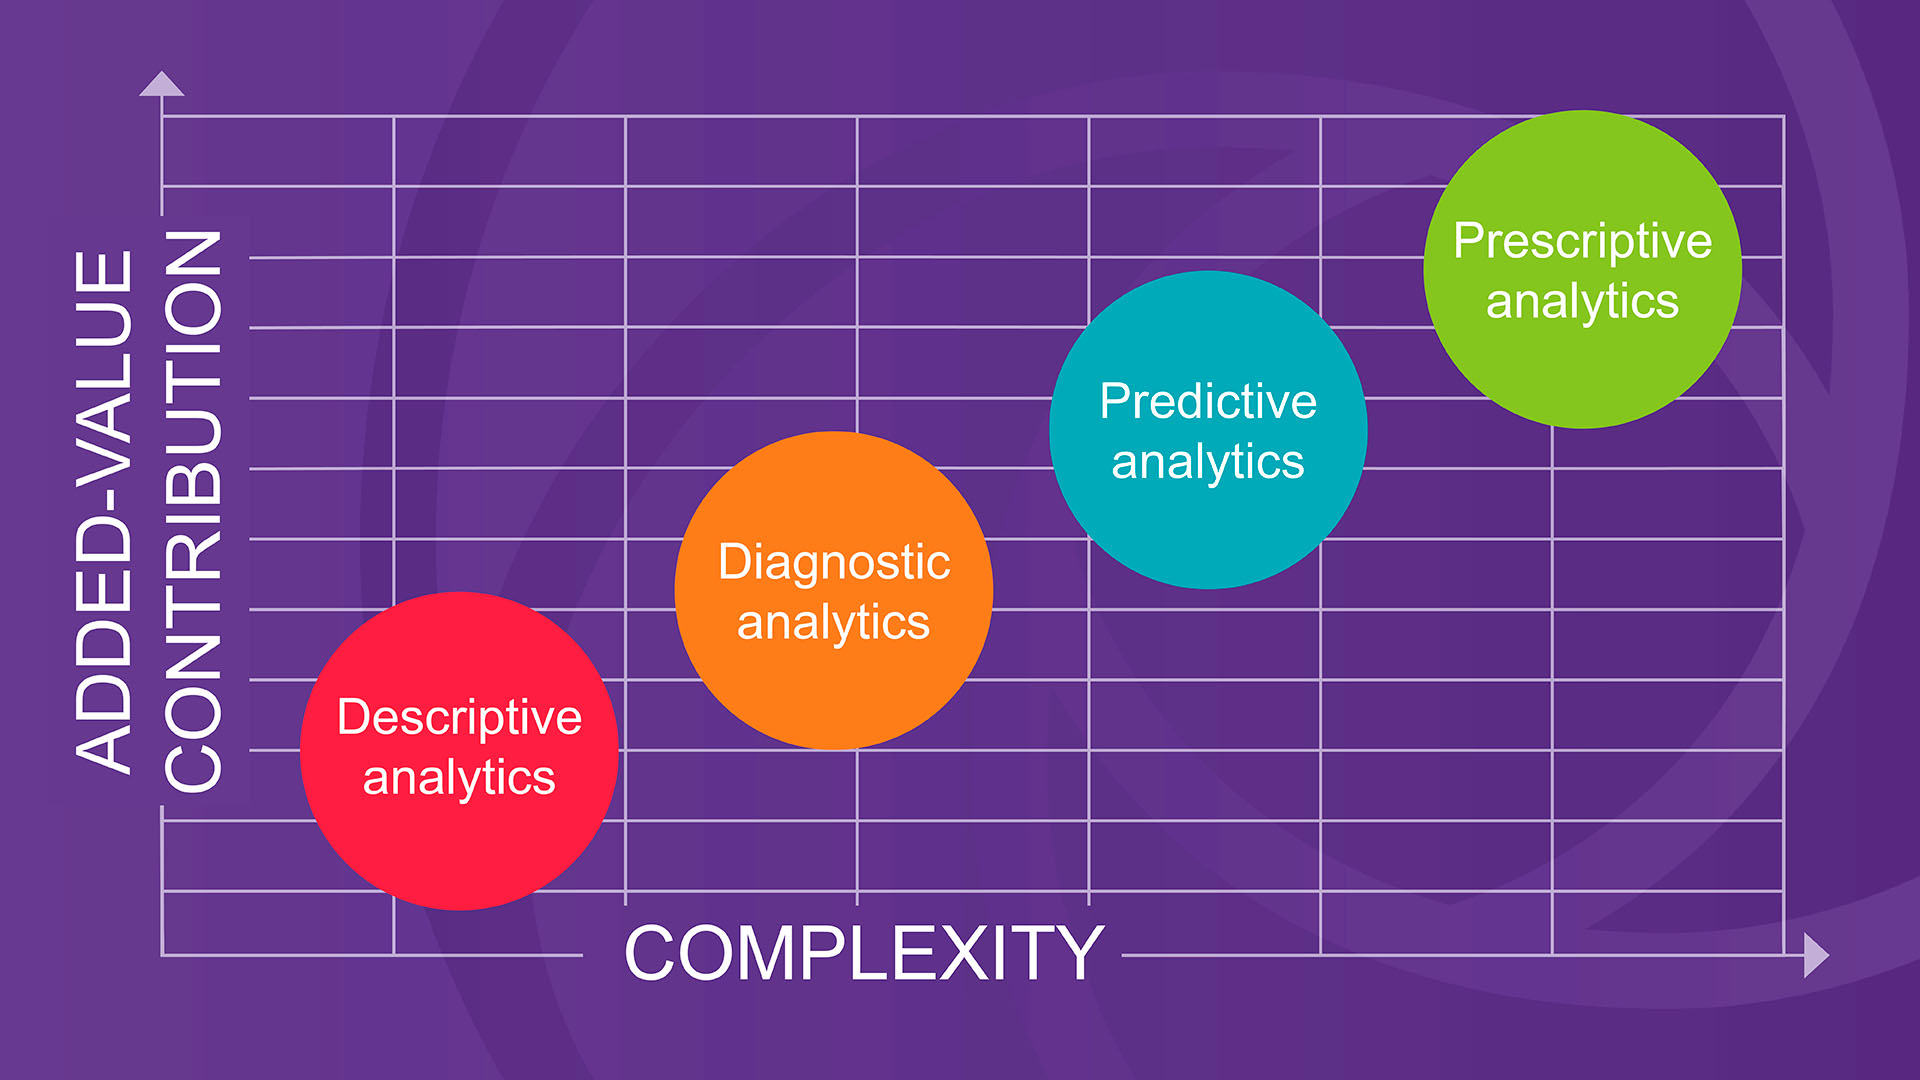
1. Descriptive analyses
This process provides better insight into a company by dissecting it using historical data. Decision-makers can gain a holistic view of performance and trends upon which they can base their business strategy. These are basic analyses that can show, for example, the development of revenue and costs over a certain period. This form of analysis only displays the data as it comes from the data sources.
2. Diagnostic analyses
Diagnostic analysis is the process of using data to determine the causes of trends and correlations between variables. It can be seen as a logical next step after using descriptive analyses. It is meant to identify trends. For example, when selling prices increase and therefore revenue also increases, it may be interesting to analyze which part of the revenue increase is due to rising selling prices and which part is due to increasing/decreasing sales. It provides insight into the reason behind the revenue increase.
3. Predictive analyses
This is a form of analysis in which a prediction is made for the future using current and historical data. If a data quality issue arises, these analyses cannot be implemented. If errors are present in the data and a prediction is made on these errors (using regression algorithms), then the errors will be extrapolated. This creates errors on top of errors and the predictions become incorrect and inaccurate.
4. Prescriptive analyses
Prescriptive analysis is an analysis in which technology is used to help companies make better decisions by analyzing raw data. Prescriptive analyses take into account information about potential situations or scenarios, available resources, past performance, and current performance to recommend an action or strategy. This form of analysis is the opposite of descriptive analysis. Descriptive analysis uses historical data that has already occurred, while prescriptive analyses use historical data and predictive data to make the right decisions in the future.